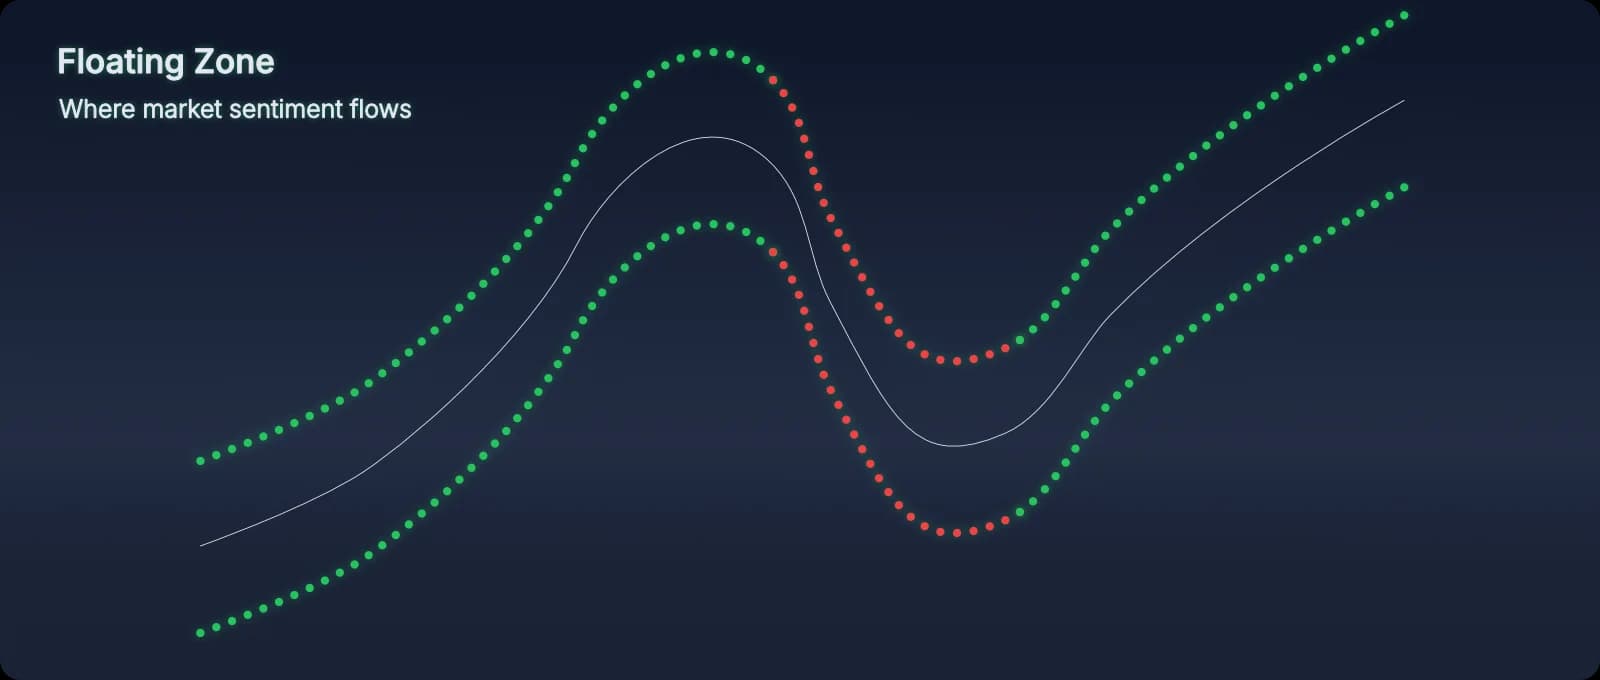
The Floating Zone: Reading Directional Momentum
The Floating Zone reveals underlying strength and weakness, and confirmation of trend change. It shows you where belief is flowing right now—not where it's been, but where the crowd is committing. It's your first filter for every setup.
What The Floating Zone Reveals
Think of The Floating Zone as the current of market belief. When it's flowing strongly in one direction, the crowd is aligned. When it's choppy or reversing, belief is uncertain or shifting. This is the foundation of understanding why retail traders lose belief before the buy—they exit just as momentum confirms.
Unlike lagging indicators that smooth price data from the past, The Floating Zone updates dynamically based on real-time perception markers. You're seeing momentum as it forms, not after it's already moved.
Key Insight
How to Use It in Practice
When you open a chart, the first question you ask is: "Is there a clear Floating Zone flow?" If yes, you're looking for entries aligned with that flow. If no, you wait.
Example Scenario: Strong Upward Flow
- What you see: The Floating Zone is flowing upward with consistent momentum.
- What it means: The crowd believes price is heading higher. Buying pressure is dominant.
- Your action: Look for pullbacks to Buffers or Pressure Point confirmations to enter long.
Example Scenario: Choppy Floating Zone
- What you see: The Floating Zone is shifting back and forth, no clear direction.
- What it means: Belief is uncertain. No dominant flow.
- Your action: Skip. Wait for clarity.
Common Mistakes It Prevents
- Trading against momentum: If The Floating Zone is flowing down, don't try to catch a bottom. Wait for reversal confirmation.
- Entering during chop: No Floating Zone flow = no setup. Don't force trades in uncertain conditions.
- Ignoring belief shifts: When The Floating Zone reverses sharply, the crowd's conviction has changed. Respect it.
Combining The Floating Zone with Other Elements
The Floating Zone works best when combined with the ray lines (belief boundaries) and Pressure Points (tests of conviction). Here's a typical high-conviction setup:
- The Floating Zone shows strong upward flow.
- Price pulls back to a ray line (perceived support).
- A Pressure Point forms at the ray line, confirming the crowd's belief.
- You enter long within the Buffer zone, knowing the structure supports the move.
From the Manual
The manual provides detailed chart examples showing Floating Zone flow in different market conditions—trending, ranging, reversing, and choppy. You'll see exactly how to interpret Floating Zone behavior and integrate it with the other PAT elements.