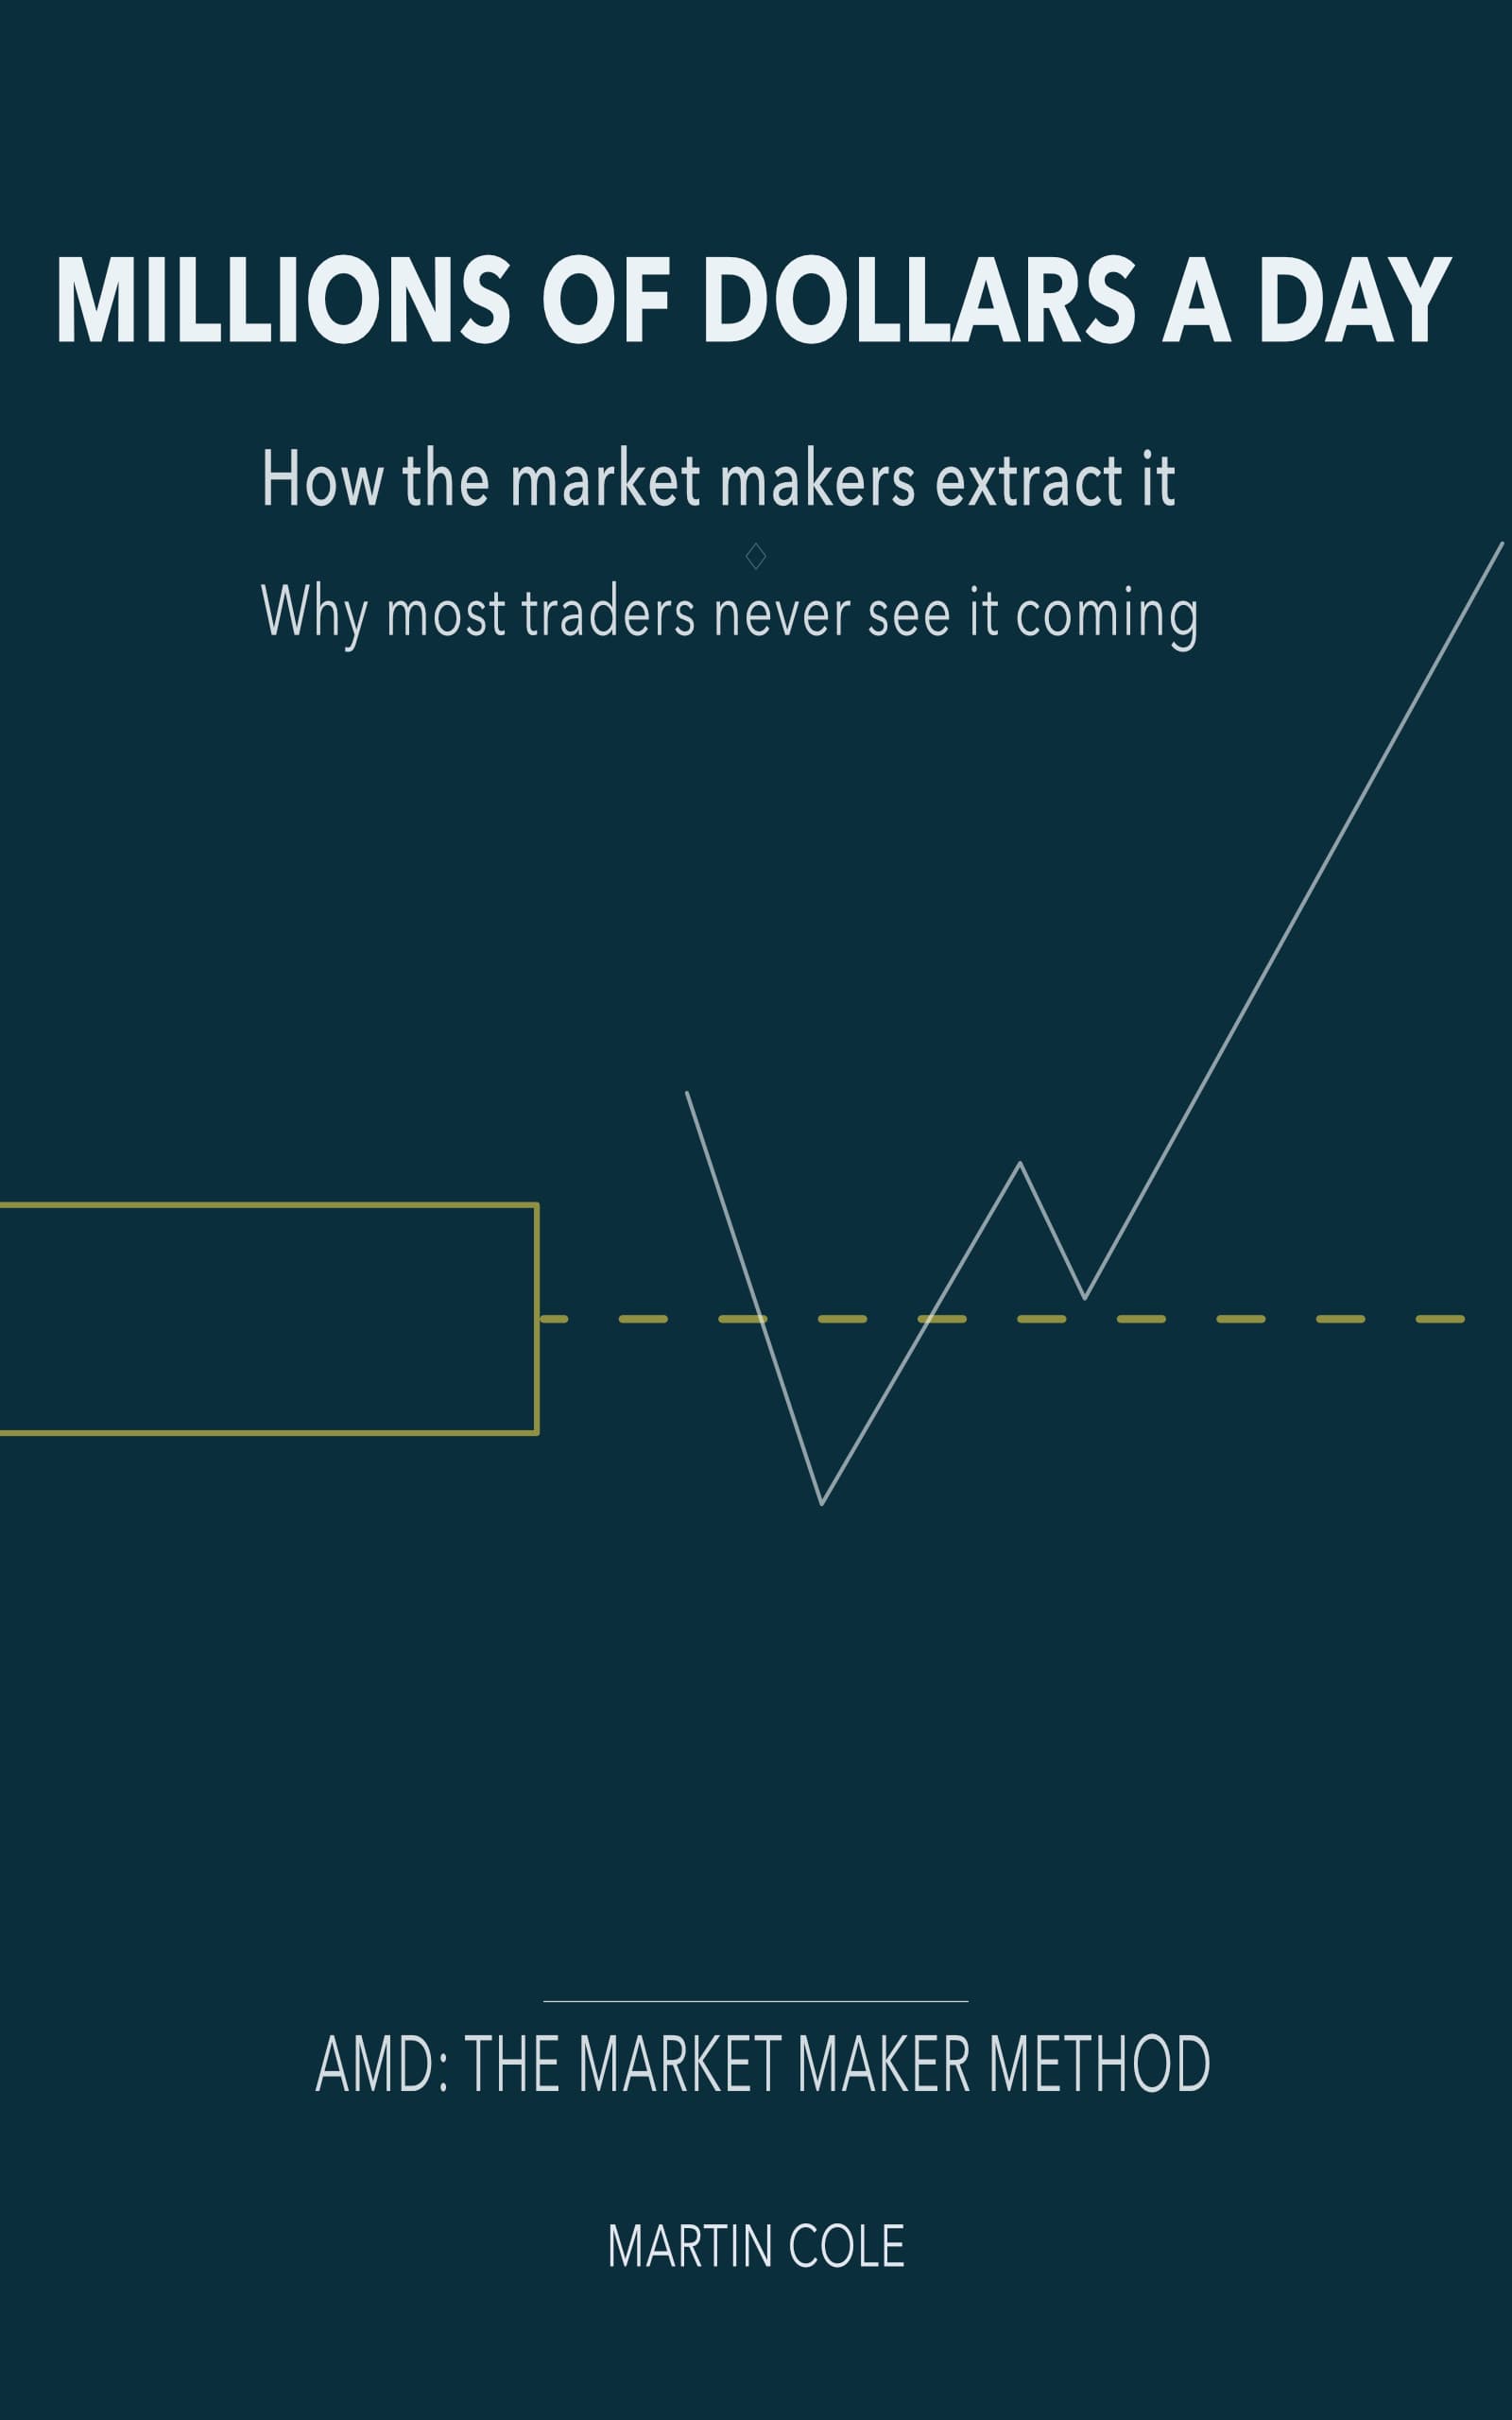
How the Market Makers Extract Millions of Dollars a Day
An exploration of the Market Maker Method and its Accumulation, Manipulation and Distribution framework.
Most indicators tell you when something has happened. PAT helps you understand what the market is attempting to do — and whether that move is being accepted or rejected.
See the pressure building. Recognise the push. Watch the response.
All on your TradingView chart.
Already a PAT customer? Your existing subscription remains in place. You do not need to subscribe again.
Your indicator says BUY. Everything looks right. You enter, expecting the market to rise.
But what happens when the market has other ideas — and doesn't do what you expected?
You don't need another trading signal telling you when to buy or sell. You need to understand whether the move you're expecting is actually developing — or beginning to fail.
Watching this video could permanently change the way you look at trading and trading indicators.
You've seen it happen. A promising move begins, confidence builds, and then the market turns against you.
The question isn't simply where to enter. It's whether the reasons behind that move are still developing — or beginning to disappear.
That's where PAT changes what you pay attention to.
01 — Notice the change
PAT draws your attention to significant developing activity that may otherwise be lost amongst ordinary candles.
02 — Understand the push
See attempts to establish new price levels and understand their relationship to the Ray Line.
03 — Keep reading
Watch for developing acceptance, rejection or changing conditions — even after you've entered a trade.
Imagine looking at a chart and finally understanding what to do — and when to do it.
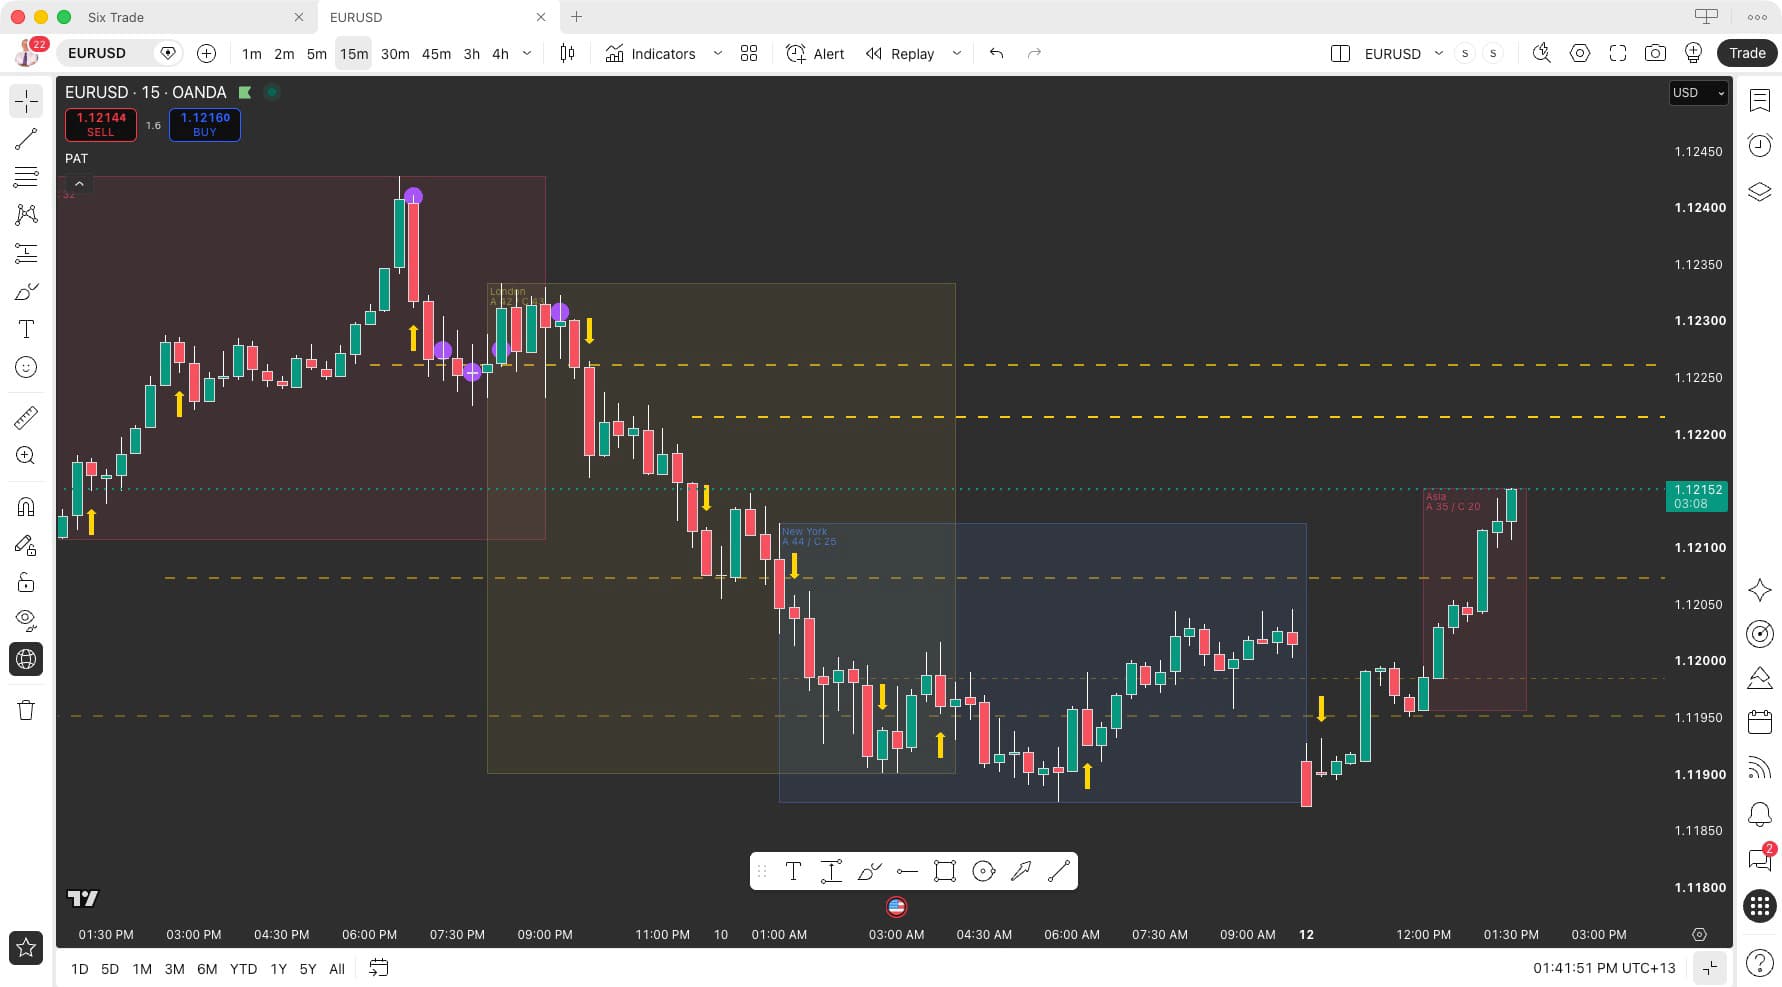
Purple Dots, Ray Lines and Pressure Points work together to help you understand what the market is attempting to do — and how it responds. Rather than following isolated buy and sell signals, you're learning to read the developing market.
Something worth your attention.
Purple Dots highlight important developing activity, inviting you to watch what happens next.
Strength above. Weakness below.
Ray Lines provide a reference for judging whether price is establishing itself at a new level or failing to hold.
A meaningful push towards a new price level.
The arrow identifies the attempt — what happens afterwards tells us whether that attempt is being accepted or rejected.
Trading Sessions provide the timing and context, helping you see when market activity develops across the forex trading day.
AMD is the methodology behind PAT. It describes how a move is prepared, shaken, and then released. Distribution is also called Profit Release, the phase in which that prepared move is released.
A candle records where price traded. PAT is read on that candle. The indicator is there so the three phases can be seen while they are developing, through Ray Lines, Pressure Points, Jump Bars, and the trading session on the chart.
These phases have been the centre of the teaching for decades. One indicator carries the read on the candle chart.
There was no TradingView. No online trading platform sitting on your desk. If you wanted to place a trade, you called your broker.
But the question that fascinated me then is the same question I've spent decades trying to answer.
What happens in a market before the price moves?
In December 1999, Futures and Options World published an article about my work called Beyond Belief. At the time, I was identifying trending days better than eight times out of ten.
That work developed into the Market Maker Method — Accumulation, Manipulation and Distribution — and the thinking behind PAT today.
Read my story →
Two published books explore the thinking behind the Market Maker Method — from Accumulation, Manipulation and Distribution to the beliefs and assumptions that influence market behaviour.
PAT for TradingView brings that methodology onto your chart.
An exploration of the Market Maker Method and its Accumulation, Manipulation and Distribution framework.

Why familiar explanations of price can overlook market structure, liquidity and the beliefs influencing trading decisions.
If you want to talk about the methodology, or about using PAT on a TradingView chart, get in touch and I'll get back to you.
Talk it through