Ray Lines: Understanding Belief Boundaries
Ray lines: Where accumulation pivots on underlying strength or weakness. They reveal where the crowd thinks support and resistance are—not where they actually are, but where they believe they are. That's the game.
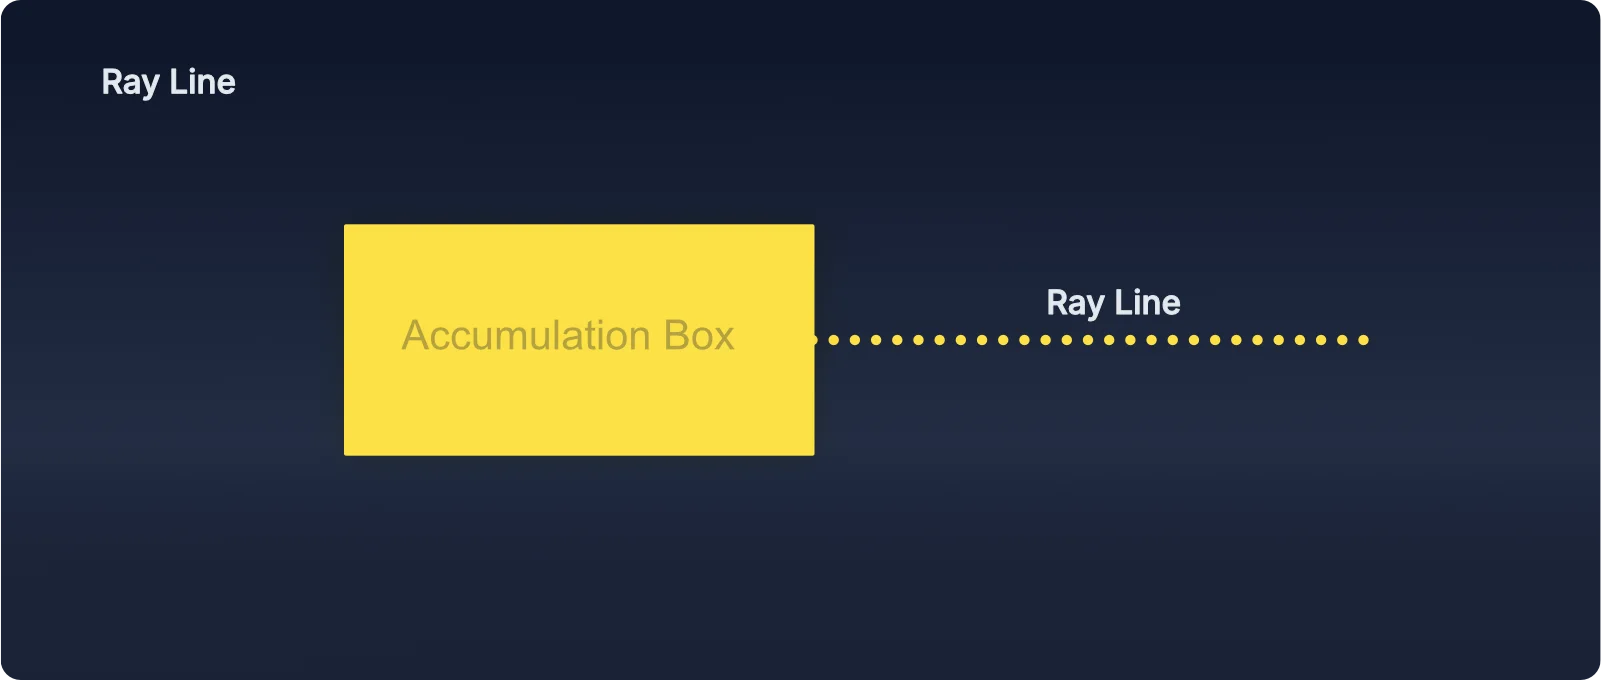
What Ray Lines Reveal
Traditional support and resistance are drawn from historical price points. Ray lines are different—they show where accumulation pivots on underlying strength or weakness, revealing where the crowd's current perception places those boundaries.
This matters because the market doesn't react to old levels—it reacts to where the crowd believes levels sit right now. Ray Lines give you that information in real time. This is a practical application of Key 6: AMD Phase Boundaries Are Fluid—support and resistance shift with collective memory.
Why This Matters
Ray Lines Are Dynamic
Here's a critical concept: Ray lines are not static. New ones form as the market moves and new accumulation zones complete. In a trending market, you'll see new ray lines appear as price progresses.
This dynamic nature is crucial for risk management. If you're holding a long position in an uptrend and a new ray line forms above the previous ones, that new ray becomes your updated reference point. It's an early warning system:
- Price stays above the new ray: Trend intact, belief confirmed, continue holding.
- Price moves below the new ray: Early signal that belief may be shifting. Time to consider taking profits or tightening stops.
You don't wait for price to fall all the way back to the original ray from where you started—that would give back most of your gains. Watch for new ray lines as progressive invalidation signals.
How to Use Them in Practice
When price approaches a ray line, you're watching for one of two outcomes:
- Respect: Price bounces off the ray line, confirming the crowd's belief.
- Rejection: Price breaks through the ray line, revealing the belief was false or manipulated.
Both scenarios give you actionable information. You're not guessing—you're reading the crowd's reaction in real time.
Example Scenario: Ray Line as Support
- What you see: Price pulls back toward a lower ray line during an uptrend.
- What it means: The crowd believes this is where buyers will step in.
- Your action: Wait for a Pressure Point confirmation at the ray line. If the crowd holds, you enter long. If it breaks, you wait for the next structure.
Example Scenario: Ray Line Break (Stop Hunt)
- What you see: Price breaks below a ray line, triggers stops, then reverses sharply back above it.
- What it means: Manipulation. The crowd was positioned below the ray line; market makers grabbed that liquidity and reversed.
- Your action: Enter when price reclaims the ray line and shows belief confirmation (Pressure Point).
Common Mistakes It Prevents
- Blindly trusting historical levels: Ray lines show you where belief sits now, not where it was months ago.
- Getting stopped out in manipulation: When you see a ray line break followed by a sharp reversal, you know it was a stop hunt. Ray lines make this visible.
- Entering too early: Wait for price to interact with the ray line and confirm the crowd's reaction before committing.
Ray Positioning: Context Matters
You'll often hear that price above a ray shows underlying strength, and price below a ray shows underlying weakness. This is true—but how you use this information depends on what the market is actually doing.
Ray lines project from areas where belief was historically formed. They naturally appear where activity concentrated—often between buffer boundaries. The key is understanding when ray positioning is a confirmation signal versus when it's simply an internal structure marker.
In Range Mode (Buffer-to-Buffer Trading)
When buffers are holding and you're trading range oscillations, ray lines act as pivot points and retest zones within that range. You're not waiting for price to be above or below the ray to enter—you're trading the buffer reactions.
The ray positioning simply tells you which side has temporary control as price oscillates between boundaries. Think of rays as internal structure markers, not entry barriers.
Range Mode Example
In Trend Mode (Buffer Breaks or Directional Moves)
When buffers break or clear directional bias exists, ray positioning becomes more significant. Here, acceptance above a ray while The Floating Zone slopes up (or below while it slopes down) confirms alignment.
After the initial move through the ray (and often through buffers), price will naturally retrace—pull back temporarily before continuing in the breakout direction. This retrace may or may not come all the way back to the ray line. Often, it doesn't.
The retrace creates a temporary pause, a few bars where price moves counter to the breakout, then continues. The base of that retrace becomes your reference point for entry and stop placement.
Trend Mode Example
The Critical Insight
Don't let "always above ray for longs, below for shorts" become a rigid rule. Ray function adapts to the AMD cycle mode:
- In ranges: Rays are pivot markers. Buffer boundaries define your invalidation, not ray crosses.
- In trends: Rays are confirmation zones. Ray penetration against Floating Zone direction signals invalidation.
Let buffer behavior tell you which mode you're in. Buffers holding = range mode. Buffers breaking = trend mode. Once you know the mode, you know how to interpret ray positioning.
Combining Ray Lines with Other Elements
Ray lines are most powerful when combined with The Floating Zone (momentum), Buffers (AMD phase boundaries), and Pressure Points (tests). A typical high-conviction setup looks like this:
- Identify the market mode (are buffers holding or breaking?).
- The Floating Zone shows clear directional flow.
- Price pulls back to a ray line (perceived support/resistance).
- A Pressure Point forms at the ray line, confirming the crowd's reaction.
- You enter based on the mode: within Buffer zone for range, on ray line retest for trend.
From the Manual
The manual includes detailed chart examples showing ray line behavior in various conditions—respected boundaries, false breaks, and manipulation patterns. You'll learn to read the crowd's belief in real time and position accordingly.