What Is the AMD Indicator?
AMD stands for Accumulation, Manipulation, Distribution (originally called Profit Release). It's the framework that reveals how market makers engineer price movements—and PAT is the original AMD indicator, created by the person who invented AMD in 1999.

The Origin: 1999
In 1999, Martin Cole created and first documented the market maker method of trading financial markets. The method consists of three market phases: Accumulation, Manipulation, and Distribution ADM (The distribution phase is also knows as the profit release phase). The method revealed how market makers and large instutions engineer price movements through the three repeating phases. It was featured as a 4-page spread in Futures & Options World magazine and documented in his 2001 book "Trading For A Bright Future."
Today, dozens of platforms teach AMD—but only PAT was created by the original source.
This Is Not a Rebrand
The Three Phases of AMD
1. Accumulation — The Quiet Phase
Accumulation is when professional capital (market makers, institutions, "smart money") quietly builds positions. The crowd isn't paying attention yet. Price often ranges or consolidates. Sentiment is uncertain.
What's actually happening: Market makers are accumulating inventory—buying (for a long move) or selling (for a short move)—without causing significant price movement. They're building their position before manipulation begins.
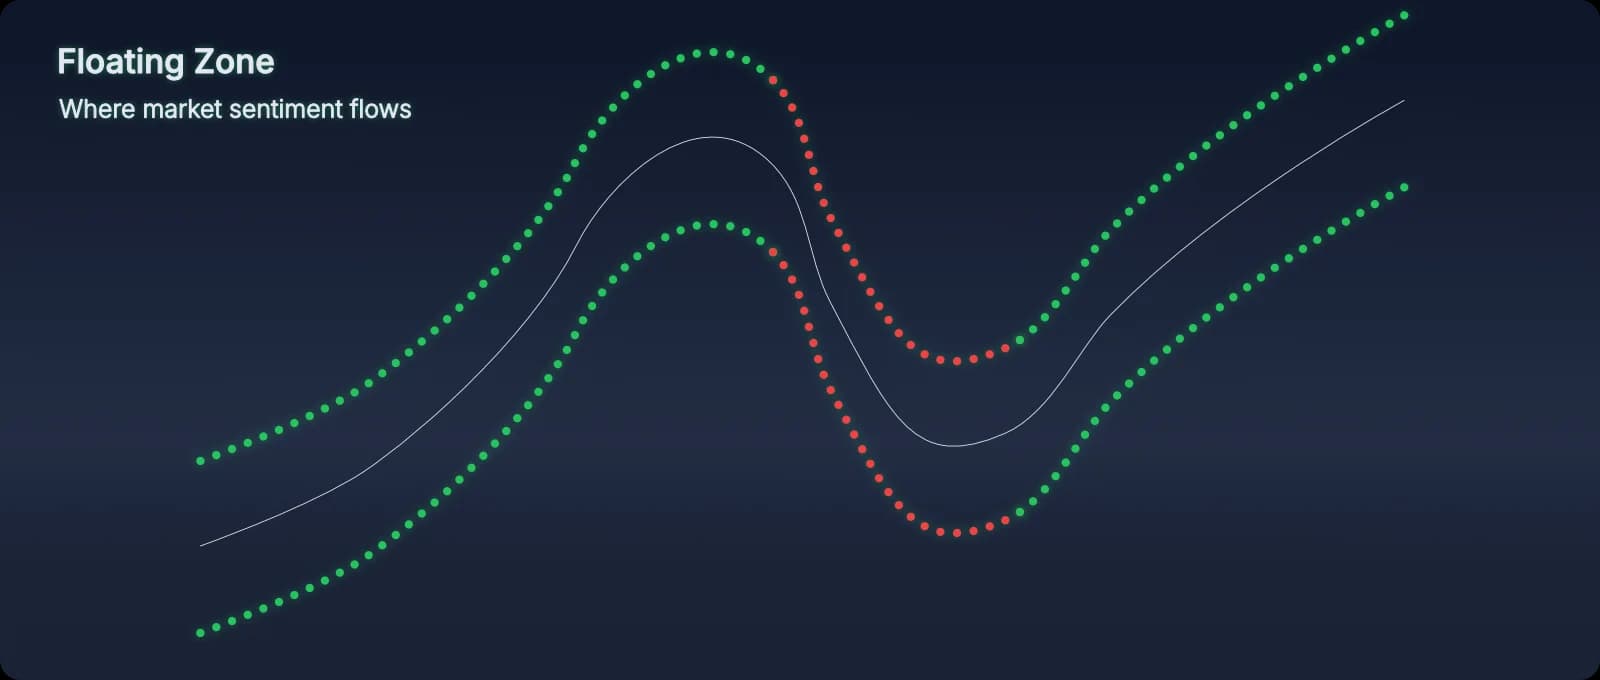
How PAT shows it: The Floating Zone reveals underlying market sentiment as professional capital builds. When The Floating Zone is quietly directional during a range, accumulation is likely forming.
2. Manipulation — The Test
Manipulation is when market makers test crowd belief and trap retail traders. This is where stop hunts, liquidity grabs, and false breakouts occur. The crowd reacts emotionally—buying tops, selling bottoms, hitting stops.
What's actually happening: Market makers are triggering retail stops to gather liquidity for the real move. They push price into zones where they know retail traders have placed their stop losses, engineering belief in one direction while preparing to move the opposite way.
How PAT shows it: Buffers reveal where manipulation zones sit. When price tests a Buffer, you're seeing a belief test in real time. If the crowd holds, the Buffer respects. If belief breaks, the trap springs.
3. Distribution (Profit Release) — The Expansion
Distribution—Martin's original term was Profit Release—is when market makers release their accumulated profits. This is where the real move happens. Price expands. The trend becomes obvious. Retail traders pile in… just as professionals are exiting.
What's actually happening: Market makers are distributing their accumulated inventory to the crowd at favorable prices. They accumulated low, manipulated higher to trap late buyers, and now they're releasing (distributing) their positions into that demand.
Why "Profit Release"? Others call it distribution. Martin's original term in 1999 was Profit Release—because that's what it actually is: the release of accumulated profits that market makers manipulated themselves into getting.
How PAT shows it: Whale Markers trigger or signal when profit release begins. When Whale Markers appear after accumulation and manipulation, you're seeing the distribution phase start.
The Complete AMD Cycle
Market makers build positions quietly (accumulation), test crowd belief and trap retail traders (manipulation), then release accumulated profits into the resulting move (distribution/profit release).
PAT shows you all three phases in real time.
How PAT Visualizes AMD
PAT—Professional Activity Tracker—was designed to render the AMD cycle visually. Each PAT element maps directly to an AMD phase:
The Floating Zone
Shows Accumulation
Reveals underlying market sentiment as professional capital builds quietly.
Learn more →Whale Markers
Signal Distribution (Profit Release)
Trigger or signal when accumulated profits are released and price expands.
See in Manual →PAT vs Other AMD Indicators
Today, there are many "AMD indicators" available on TradingView and other platforms. Here's what makes PAT different:
| Feature | PAT (Original AMD Indicator) | Other AMD Indicators |
|---|---|---|
| Created by | Martin Cole (inventor of AMD, 1999) | Various developers |
| Origin | Built by the original source | Interpretation of AMD concepts |
| Repainting | No repainting—signals never change | Varies by indicator |
| Phase visualization | All three phases (accumulation, manipulation, distribution) in real time | Often focuses on one phase or generic signals |
| Authority | 26 years of teaching AMD from the creator | Learned from secondary sources |
Why AMD Matters for Your Trading
Most retail traders lose because they trade what they think is happening instead of what's actually happening. They buy breakouts (manipulation), sell support (traps), and exit just before the real move (distribution).
Understanding AMD changes everything:
- You stop falling for traps. When you see manipulation for what it is, you don't get stopped out.
- You enter with professionals, not against them. You wait for accumulation confirmation, not FOMO entries.
- You exit when distribution begins. You're releasing profits while the crowd is still buying.
Getting Started with PAT AMD Indicator
PAT is available on TradingView. You'll see The Floating Zone, Buffers, and Whale Markers rendering AMD structure in real time—no repainting, no guessing, no lagging indicators.
Start with the Manual to understand how each element works. Then explore the individual feature pages to dive deeper into each AMD phase:
- The Floating Zone — Understanding Accumulation
- Buffers — Spotting Manipulation
- Whale Markers — Recognizing Distribution (Profit Release)