Buffers: Trading the Range Advantage
Buffers are structural boundaries that reveal whether the market is consolidating or breaking out. Understanding how price interacts with these boundaries gives you a decisive edge in both range-bound and trending markets.
The Statistical Reality
Markets typically trend on 2 out of 5 trading days and range-trade on 3 out of 5 days. This creates a fundamental problem for trend traders: they're fighting a 3:1 disadvantage. Most of the time, the market is oscillating, not trending—meaning trend traders spend 60% of their time getting chopped up in sideways action.
PAT Indicator's core strength lies in exploiting this statistical reality. Buffers allow you to profit from range-bound markets, turning the 3:1 disadvantage into a 3:1 advantage.
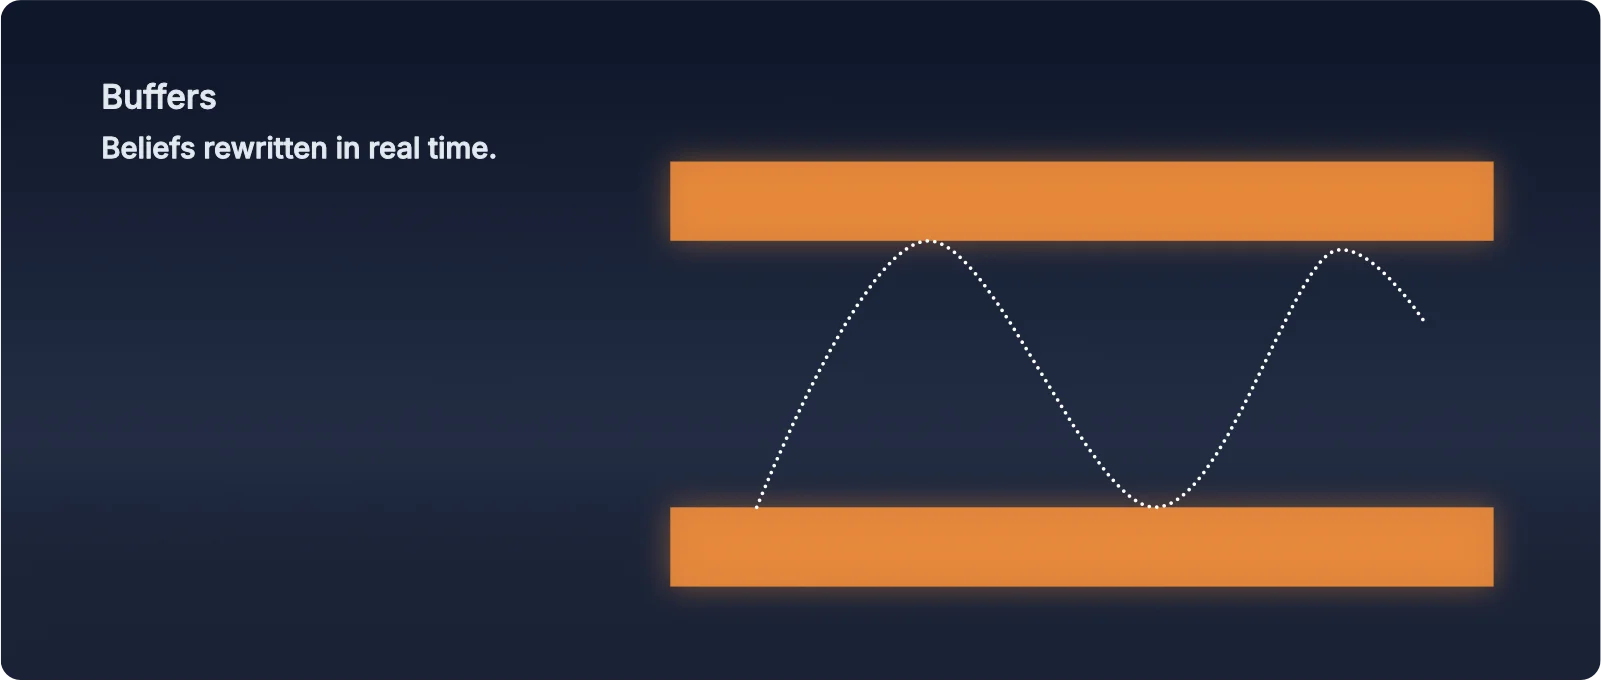
What Buffers Actually Are
Buffers are AMD phase boundaries that define where collective belief has historically shifted. They're not entry points—they're decision zones that reveal the AMD cycle and directional intent. These zones are closely related to the concept of buffer zones in stop loss hunting, where liquidity clusters just beyond obvious levels.
Think of buffers as the walls of a trading range. Understanding how price interacts with these walls tells you what the market is trying to do.
Scenario 1: Buffer Holds (Range-Bound Trading)
When price approaches a buffer, tests it, and rejects back into the range, the buffer is "holding." This signals:
- The boundary is respected
- Collective belief hasn't shifted
- The range remains intact
What to Observe
- Penetration attempt: Price pushes into or slightly through the buffer
- Rejection: Price reverses back into the range
- Whale confirmation: If a whale marker appears during rejection, it adds institutional weight—confirming the buffer is defended
Trading Guideline
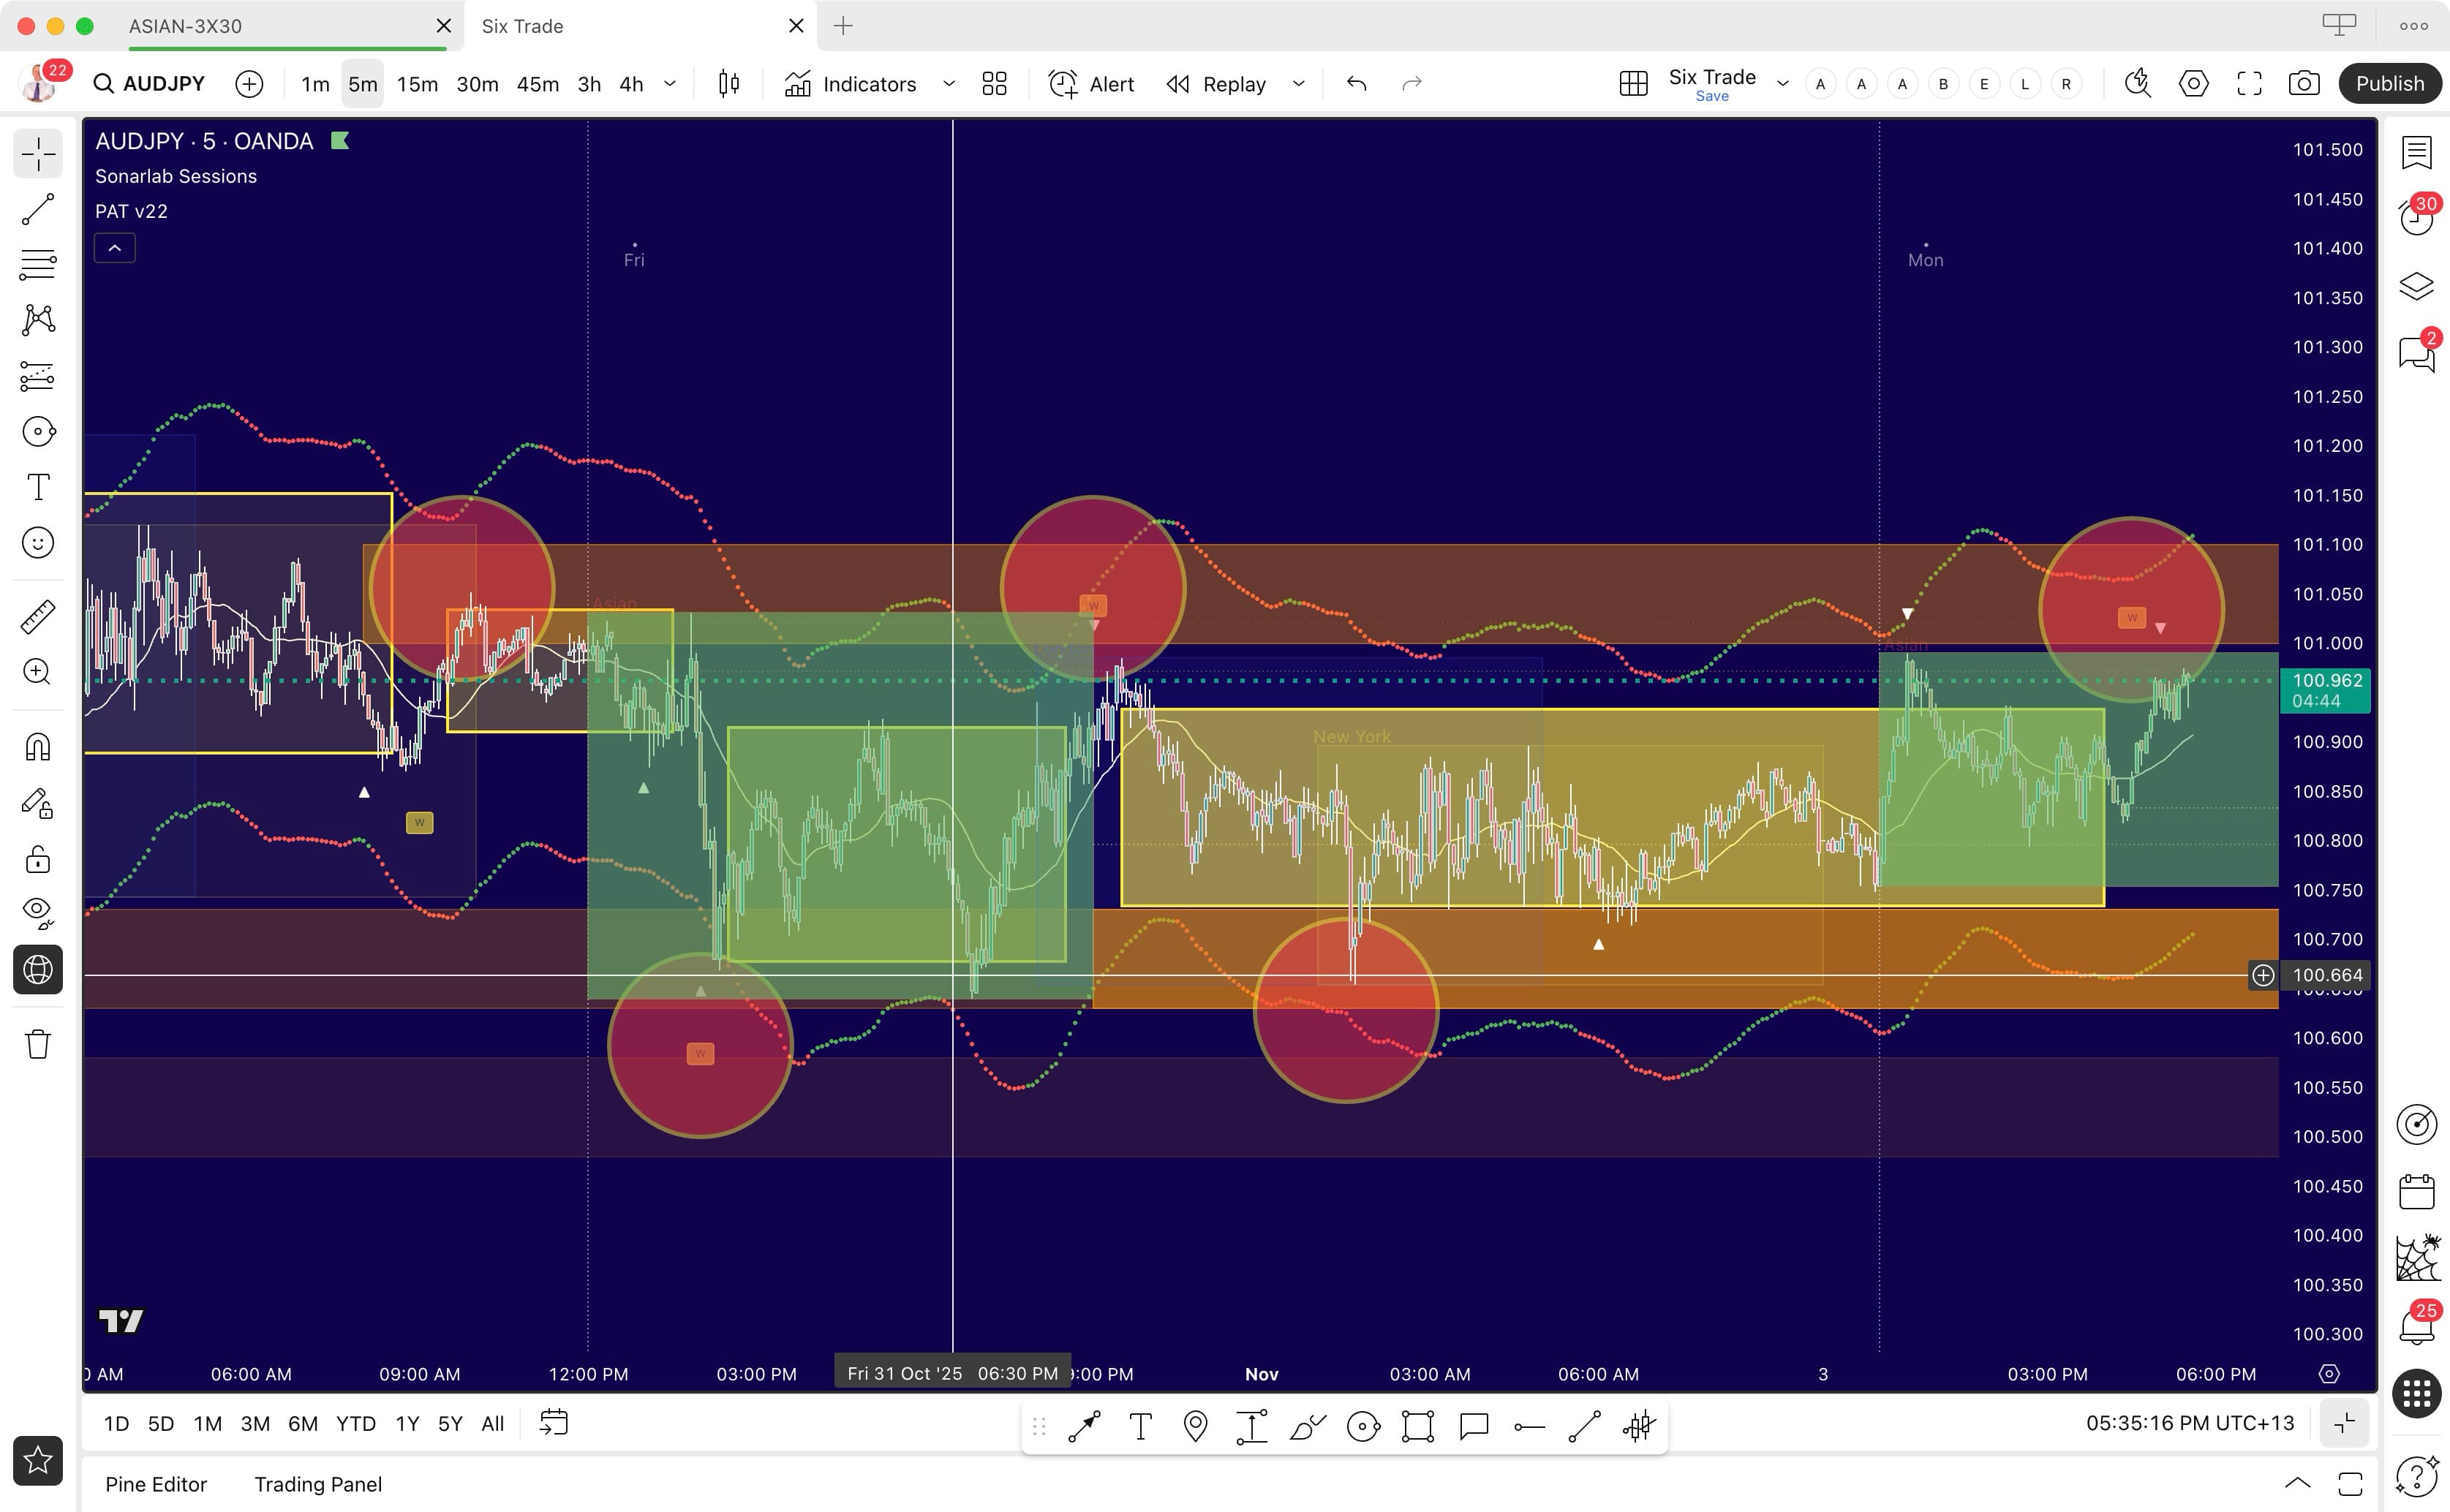
Real-World Example: Buffer Holds
The chart below demonstrates buffer holds and range-bound trading. Notice how price oscillates between the orange buffer lines—testing, rejecting, and moving toward the opposing buffer repeatedly. The red circles are manually drawn to highlight key areas where price interacts with the buffers and where whale markers (small squares with "W") appear, adding institutional weight to the rejections.
This is the type of AMD cycle behavior you'll see 60% of the time—where most traders get chopped up, but where PAT Indicator gives you clear boundaries to trade the oscillation profitably.
Scenario 2: Buffer Breaks (Trending Move)
When price breaks through a buffer and continues beyond it, the buffer has failed. This signals:
- Collective belief has shifted
- The range constraint is broken
- A significant directional move is likely
Critical insight: Whale markers add momentum to breaks. When a whale marker appears at a buffer and that buffer subsequently breaks, the institutional activity that was "containing" the market now provides added momentum to the breakout. The energy that was holding the boundary becomes the fuel for the move.
What to Observe
- Buffer break: Price pushes through and holds beyond the buffer
- Continuation: Price doesn't pull back into the range—it keeps moving
- Whale amplification: If a whale marker was present at that buffer, the break tends to be stronger and more sustained
- Next target: Price typically moves toward the next buffer (if one exists) or has no resistance until it finds the next structural level
Trading Guideline
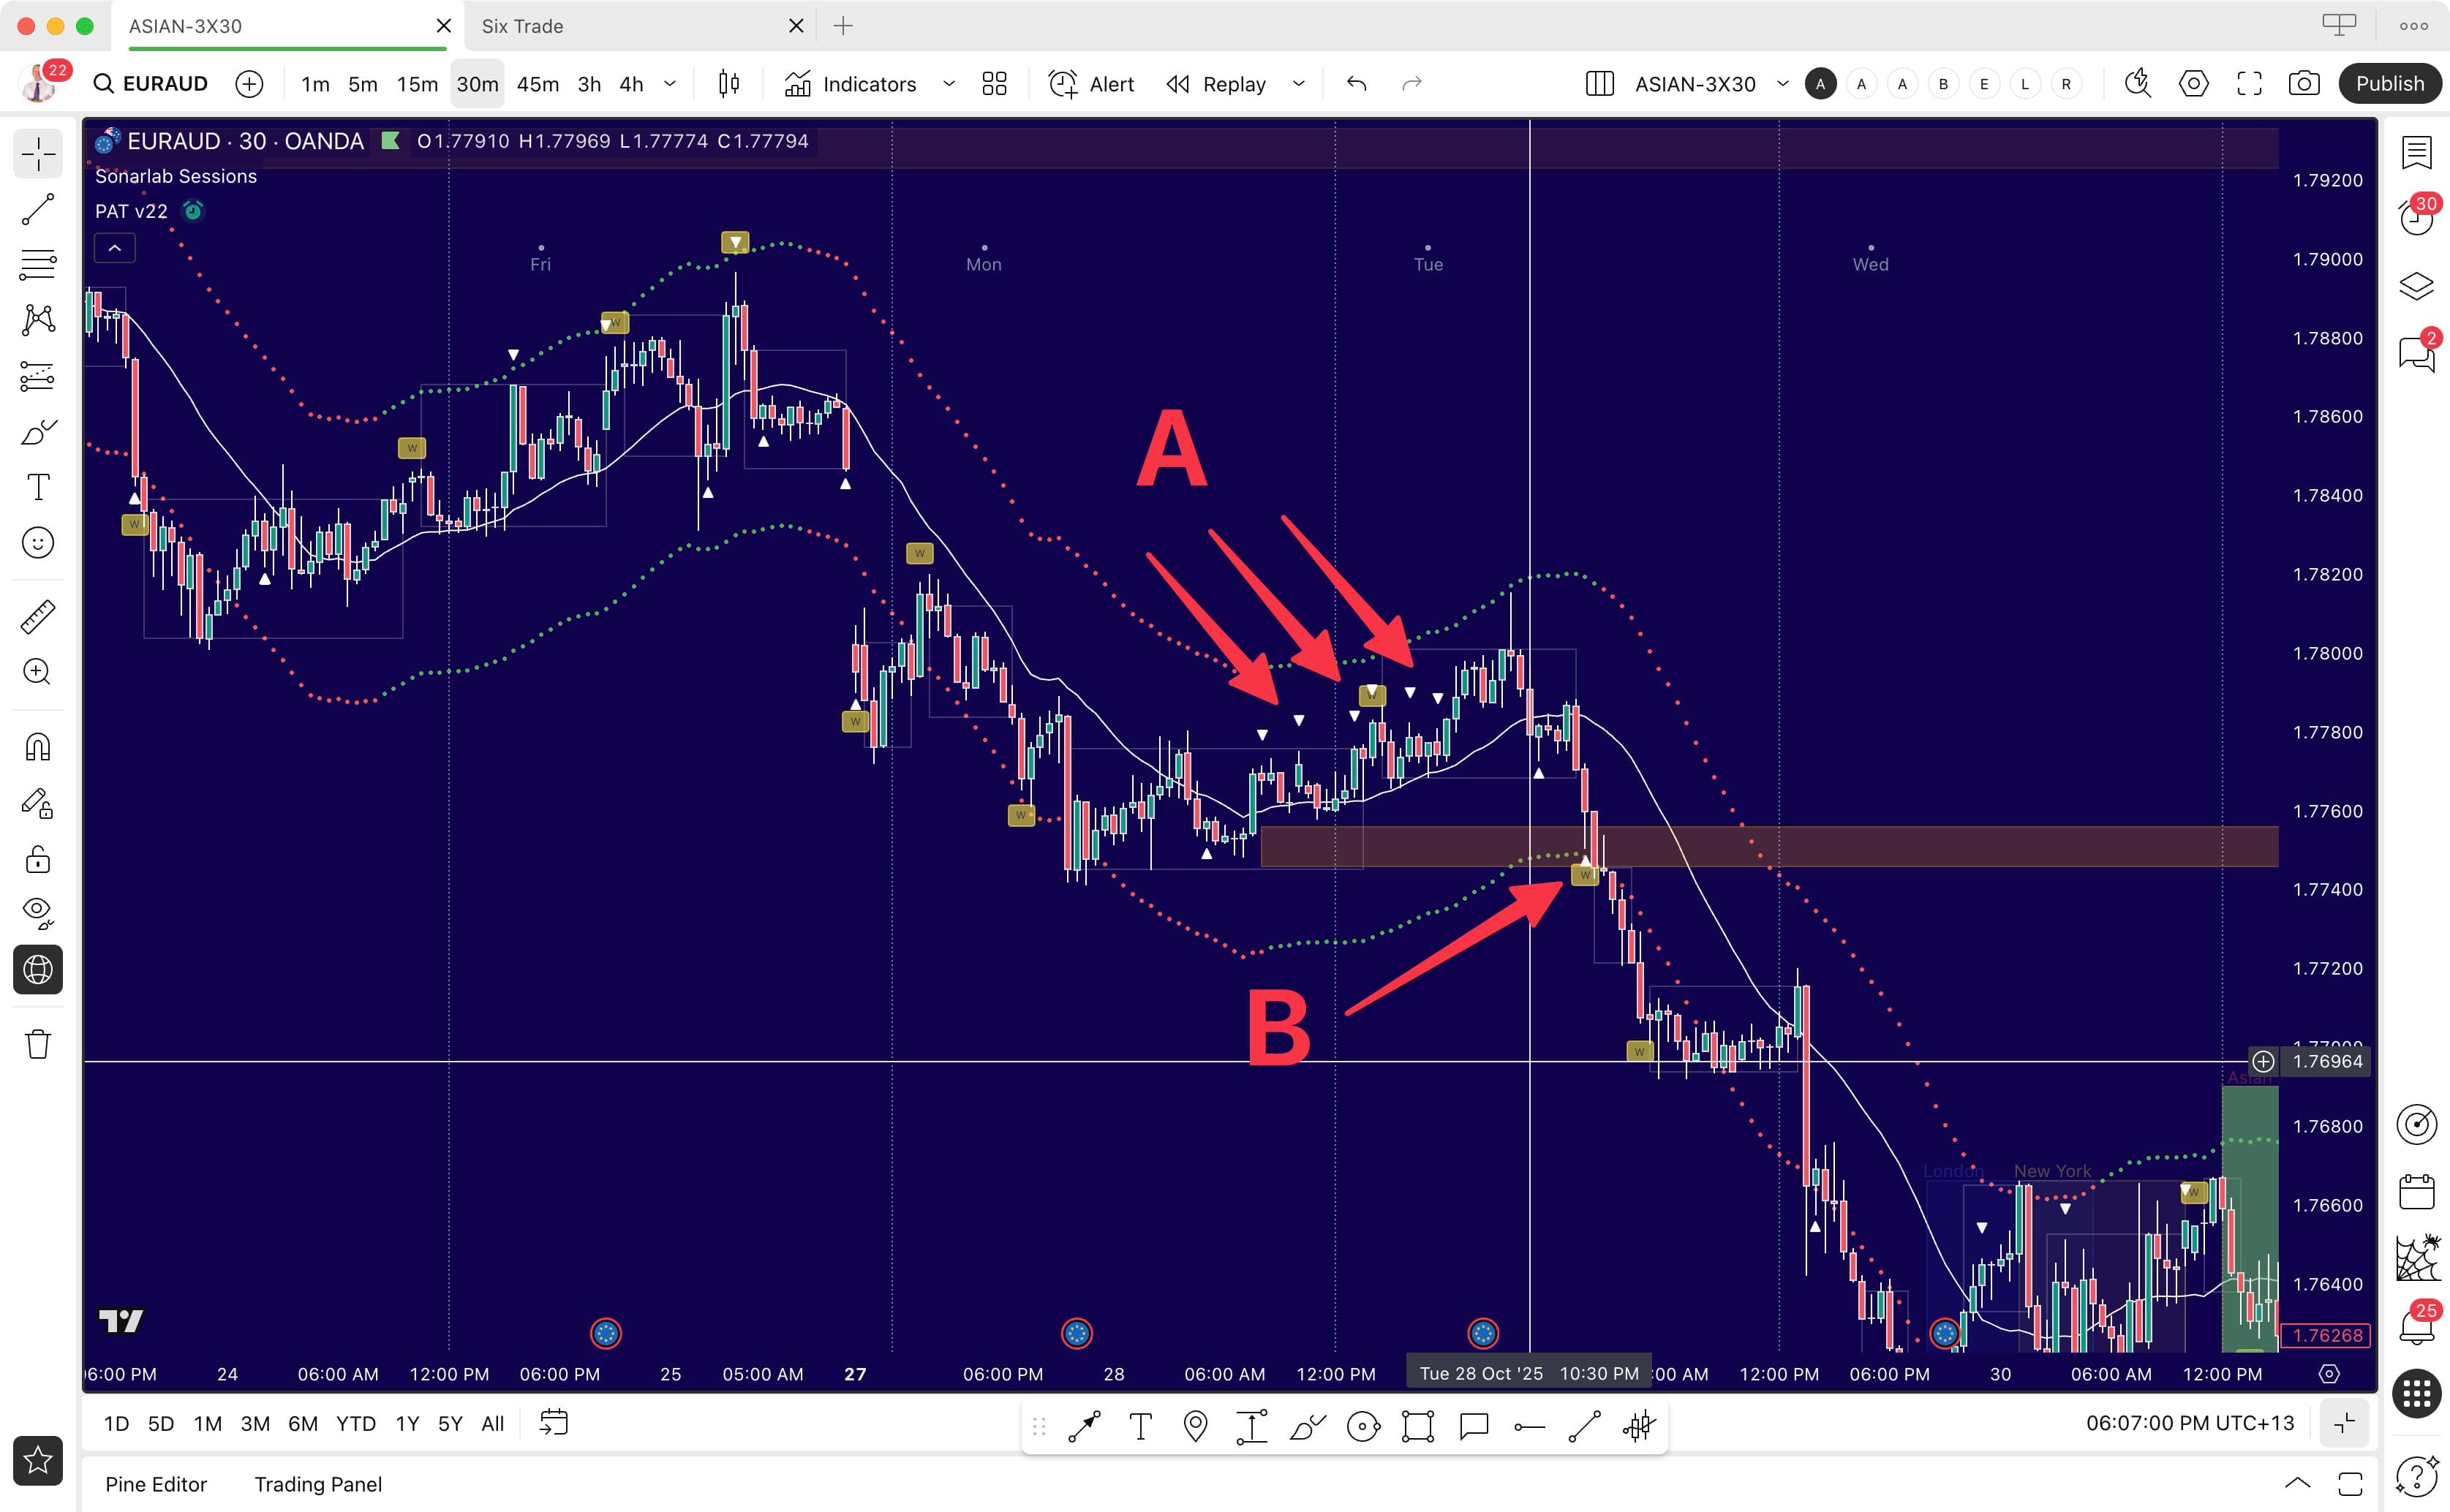
Real-World Example: Buffer Break with Pressure Point Context
The chart below demonstrates Scenario 2: Buffer Breaks. At Point A, notice the buildup of pressure points to the downside (white clustering pressure points)—this shows mounting selling pressure and belief fracturing. Then at Point B, we see the brown buffer zone where a whale marker appears. Price then breaks through that buffer and continues into a significant downward trend.
This example shows how PAT elements work together: Pressure Points reveal the building tension, the whale marker at the buffer signals high-intent activity, and the buffer break confirms the shift from range to trend. This is where the 40% trend opportunities emerge—but you've identified them through structure, not guesswork.
Whale Markers: The Conviction Multiplier
Whale Markers: Where professional, large trading positions enter and exit (Smart Money Concept). Their presence at buffers creates two distinct patterns:
At Buffer Rejections
Whales defending a boundary → Higher confidence the buffer will hold → Trade the range with institutional backing.
At Buffer Breaks
Whales present during containment → When break occurs, their activity provides momentum → The constraint becomes propulsion → Stronger, more sustained moves.
The PAT Indicator Advantage in Practice
60% of the time (3 out of 5 days), the market is range-bound. Traditional trend traders:
- Enter positions hoping for trends
- Get stopped out repeatedly in sideways action
- Only profitable 40% of the time (2 trend days)
- This is why you make money on one or two trending days and then systematically hand it back through the non trending days (usually with interest paid on top)
With buffer awareness, you:
- Recognize range structure immediately
- Trade buffer-to-buffer oscillations profitably
- Identify genuine breaks when trends emerge
- Maintain profitability across both market conditions
Guidelines for Buffer Trading
These are observational principles, not rigid rules:
- Identify the active buffers: Where are the current boundaries?
- Watch buffer interactions: Is price testing, rejecting, or breaking?
- Check for whale presence: Does institutional activity confirm or amplify the move?
- Understand the mode: Range mode (trade rejections, target opposing buffers) or Break mode (respect the shift, look for continuation)
- Position in the middle: The space between buffers is where you manage trades, not at the edges
- Let structure guide stops: Place stops beyond buffer breaks (where genuine structure fails), not arbitrary distances
The Core Insight
Buffers aren't "safe entry zones" or "dangerous reversal zones." They're structural information—revealing whether the market is consolidating (range) or shifting (trend).
By understanding buffer behavior, you gain an edge in the 60% of time when most traders are confused by sideways action. And when breaks occur, you're not surprised—you've been watching the structure that everyone else ignored.
This is how PAT turns the statistical disadvantage of trend trading into a structural advantage.
From the Manual
The manual includes detailed chart examples showing buffer holds, buffer breaks, whale marker interactions, and complete trading scenarios. You'll see exactly how to read buffer structure in real market conditions and adapt your approach accordingly.